Create and Manage Debugger Targets
Before you can start debugging a project, you must first create your debug targets. Creating multiple targets allows you to:
Quickly debug the same application with different command line arguments to test different scenarios.
Debug more than one application.
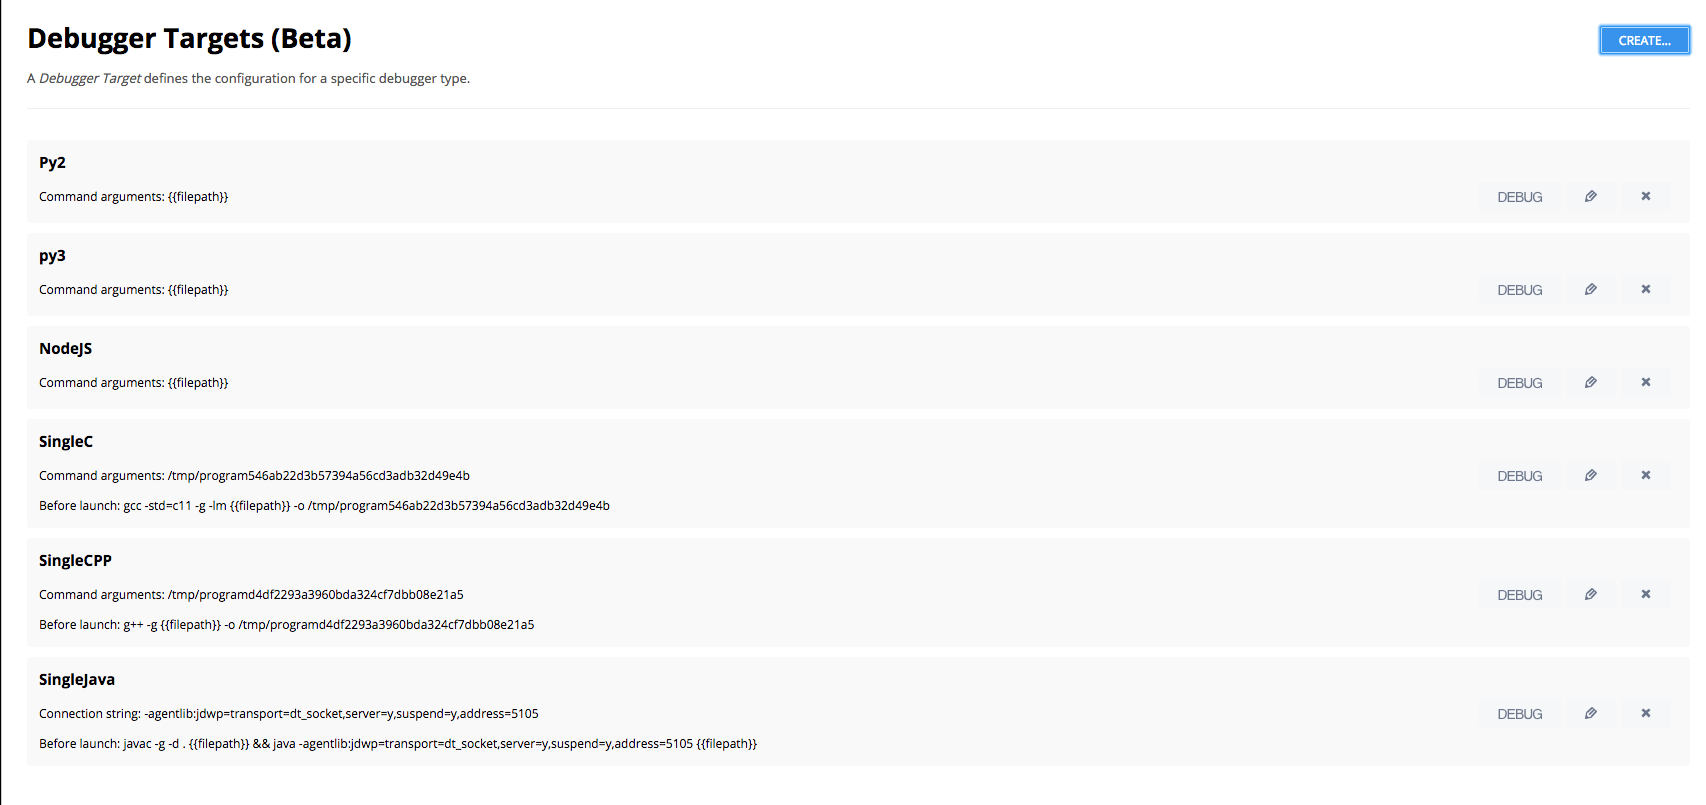
You manage your debug targets on the Debugger Settings page.
Create a debug target
To create a debug target, follow these steps:
Click the Tools tab on the menu bar and choose Debugger Settings. Alternatively, you can click the Configure tab on the far right on the menu bar.
On the Debugger Settings page, click Create.
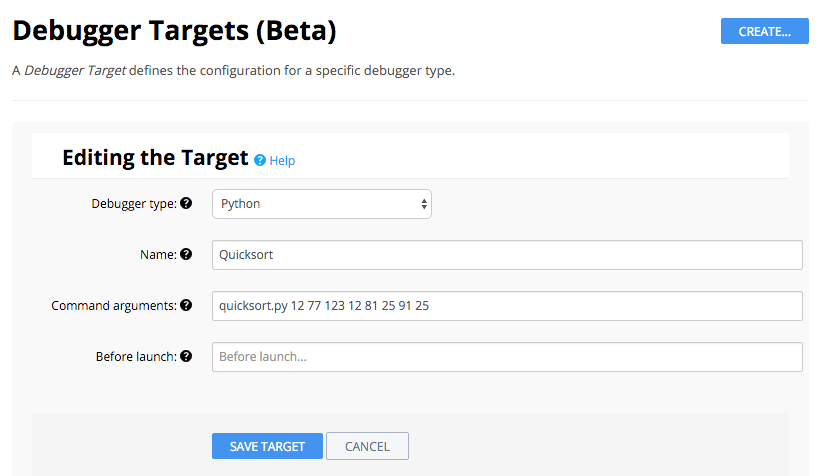
Click the Debugger Type drop-down and choose the programming language.
If you are using C, C++, or Java, and debugging a simple single code file project, choose Single C File, , or Single Java file so you don’t need to provide detailed compile and run configurations.
The field that are displayed depend on the programming language that is selected.
Enter a Name for the configuration and then complete the fields on the form. Typically, you need to provide:
The command to execute to your program along with any command line parameters you may want to include.
Command to execute before debugging starts. This is usually a compile process.
You can also reference the active file in use using
{{filepath}}token which inserts the path and full file name (/path/to/file.ext).If you are not using a single file configuration, you must also complete the following fields:
Before Launch - Compilation or build command.
Launch - Command to launch the program.
If you are creating a target for a Java application, you must also set the Debugger Port Number to 5105.
Click Create Target.
You are now ready to Start Debug Session.