Start Debug Session
You can launch an application in debug mode using one of the following methods:
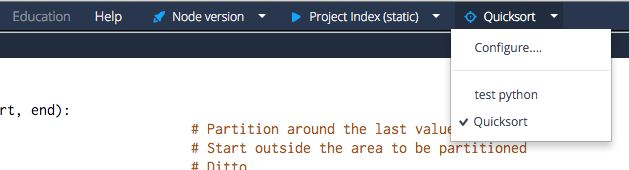
Click the Configure tab on the menu bar and choose your target from the drop-down list. If you have previously run the debug target, you can simply click the debug target the next time you want to run it.
On the Debugger Targets page, click Debug for the target you want to run.
Launch debugger from a page. See Custom Buttons for details.
The debugger launches and displays the code running. It may take a few seconds to load.
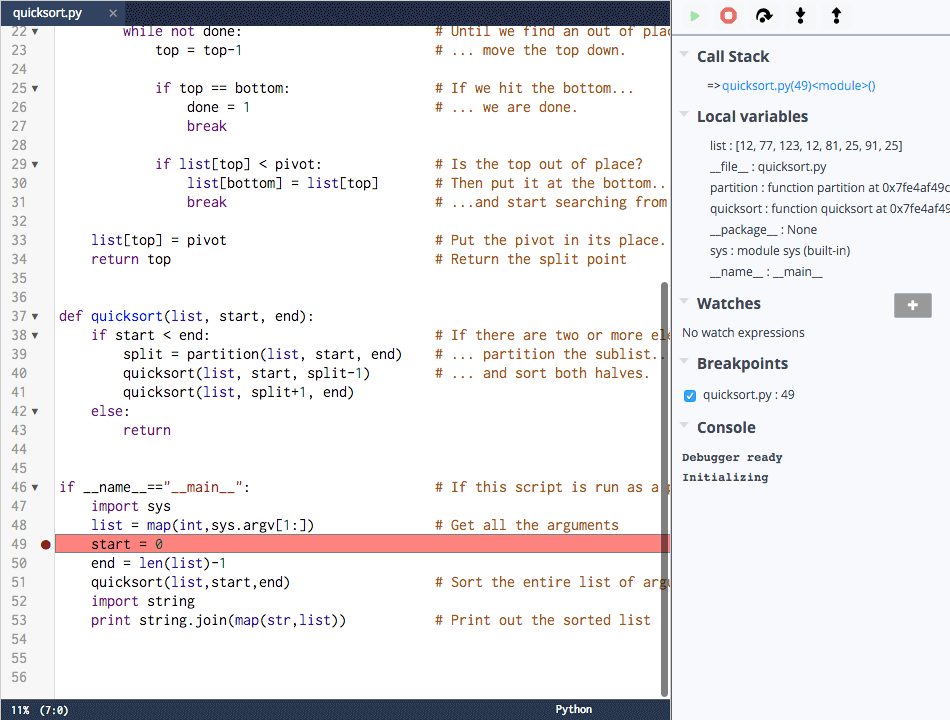
It automatically stops on the first line of code, whether or not there is a breakpoint set. A breakpoint is a line of code where the debugger pauses code execution.
To set a breakpoint, click in the gutter next to the line number. When a breakpoint is set, a red dot appears on the line.
Click the set breakpoint to remove it.
Debugger controls
Use the following controls at the top of the debug panel to perform actions to execute the debugger after it stops code execution:
Resume - Continues execution without stopping until another breakpoint is encountered.
Stop - Stops execution and closes the debug window.
Step over - Debugger executes the next line of code and then stops. If the line of code about to be executed is a function, it executes the contents of that function but does not stop unless the function contains a breakpoint.
Step into - Debugger executes the next line of code and then stops. If the line of code about to be executed is a function, it stops on the first line within that function.
- Step out - Debugger exits the current function and stops on the next line of the calling function. If the current line is the main
entry function of the application, execution ceases and the debugger automatically restarts.
Debugger features
The debug panel also includes the following features:
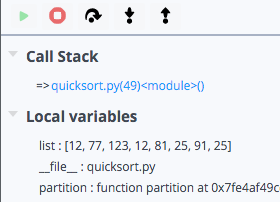
Call stack - Shows the parent functions relative to the function that contains the currently executing line of code.
Local variables - All local variables of the current function and their current values are automatically displayed.
Watches - Allows you to watch a specific variable and expressions for some languages.
Breakpoints - Lists all the breakpoints currently set in any of your code files. You can disable them by unchecking the check boxes.
Console - Displays status messages from the system and output data when you write output to the console (for example, a
print('message')statement in Python).
Standard input support
Support for standard input (stdin) is available for:
C/C++
Node.js
GDB
Node example:
function testStdIn() {
    console.log("What is your name?");
    process.stdin.once('data', (chunk) => {
        let name = chunk.toString();
        console.log("Hello, " + name + "!");
    });
}

testStdIn()