Flode
Flode is a flowcharting application, using Javascript as its engine, that allows you to:
create annotated flowcharts
execute flowcharts
write proper code expressions, including decisions, in chart elements
integrate a debugger
export charts as images for project write-ups
input and output elements so automated tests can auto-grade charts
Warning
Pair Programming should not be used for Flode assignments.
Creating and editing a new Flode file
If you want to create Flode charts in your content, start by creating either a new project or assignment in your course. You can use any stack.
Once inside a project, to create a new flowchart, simply create a new file with the extension .flode. A new Flode window will appear and you can start creating and editing your chart.
A new file is created from either the File menu or by right-clicking on the project name line in the file tree.
To edit an existing .flode file, simply click on the file name to open the Flode editor.
Dragging in blocks
Drag from the top toolbar into the chart.
Connecting blocks with lines
Hover over a block to see the connection points
Move the mouse over one of the small connection point circles
Click and drag with the mouse to start creating the line
Release the mouse to move in another direction then click to change direction again or connect to another connection point
Resizing blocks
Click on a block then drag a highlighted point
Zooming & centering your chart
Zoom controls are in the toolbar or using the mouse wheel if you have one
Multi selection
Press the shift key then drag the mouse to surround blocks to multi-select
Select one block then press the shift key then start dragging the mouse
Aligning blocks
Multi select the blocks to align
Right click and select one of the alignment options
Undo & Redo
Undo
Ctrl+Z(PC)Cmd+Z(Mac)Redo
Shift+Ctrl+Z(PC)Shift+Cmd+Z(Mac)
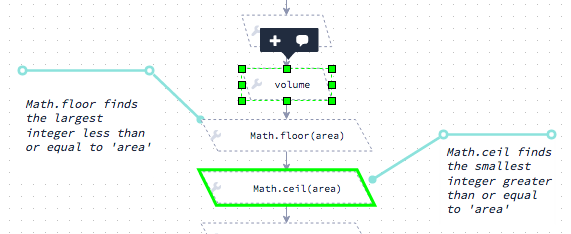
Adding comments
Click on a block then press the speech bubble icon to add a comment.
Video overview
Credits
Many thanks to the folks at JGraph for their flowcharting and diagramming tools.